What Actually Saved Our Relays: An Allocator That Lets Go, and Swap Sized to Park the Rest
The circuit-building flood ballooned individual 1AEO relays to tens of GiB of resident memory. Some relays were repeatedly OOM-killed by the kernel; most rode the flood out untouched. Our cost post tallied the bill; this short companion post reports the controlled comparison behind who survived and why. The answer has two ingredients, and neither works alone — and in late July, production ran the test again for us.
The Experiment: Five Matched Pairs #
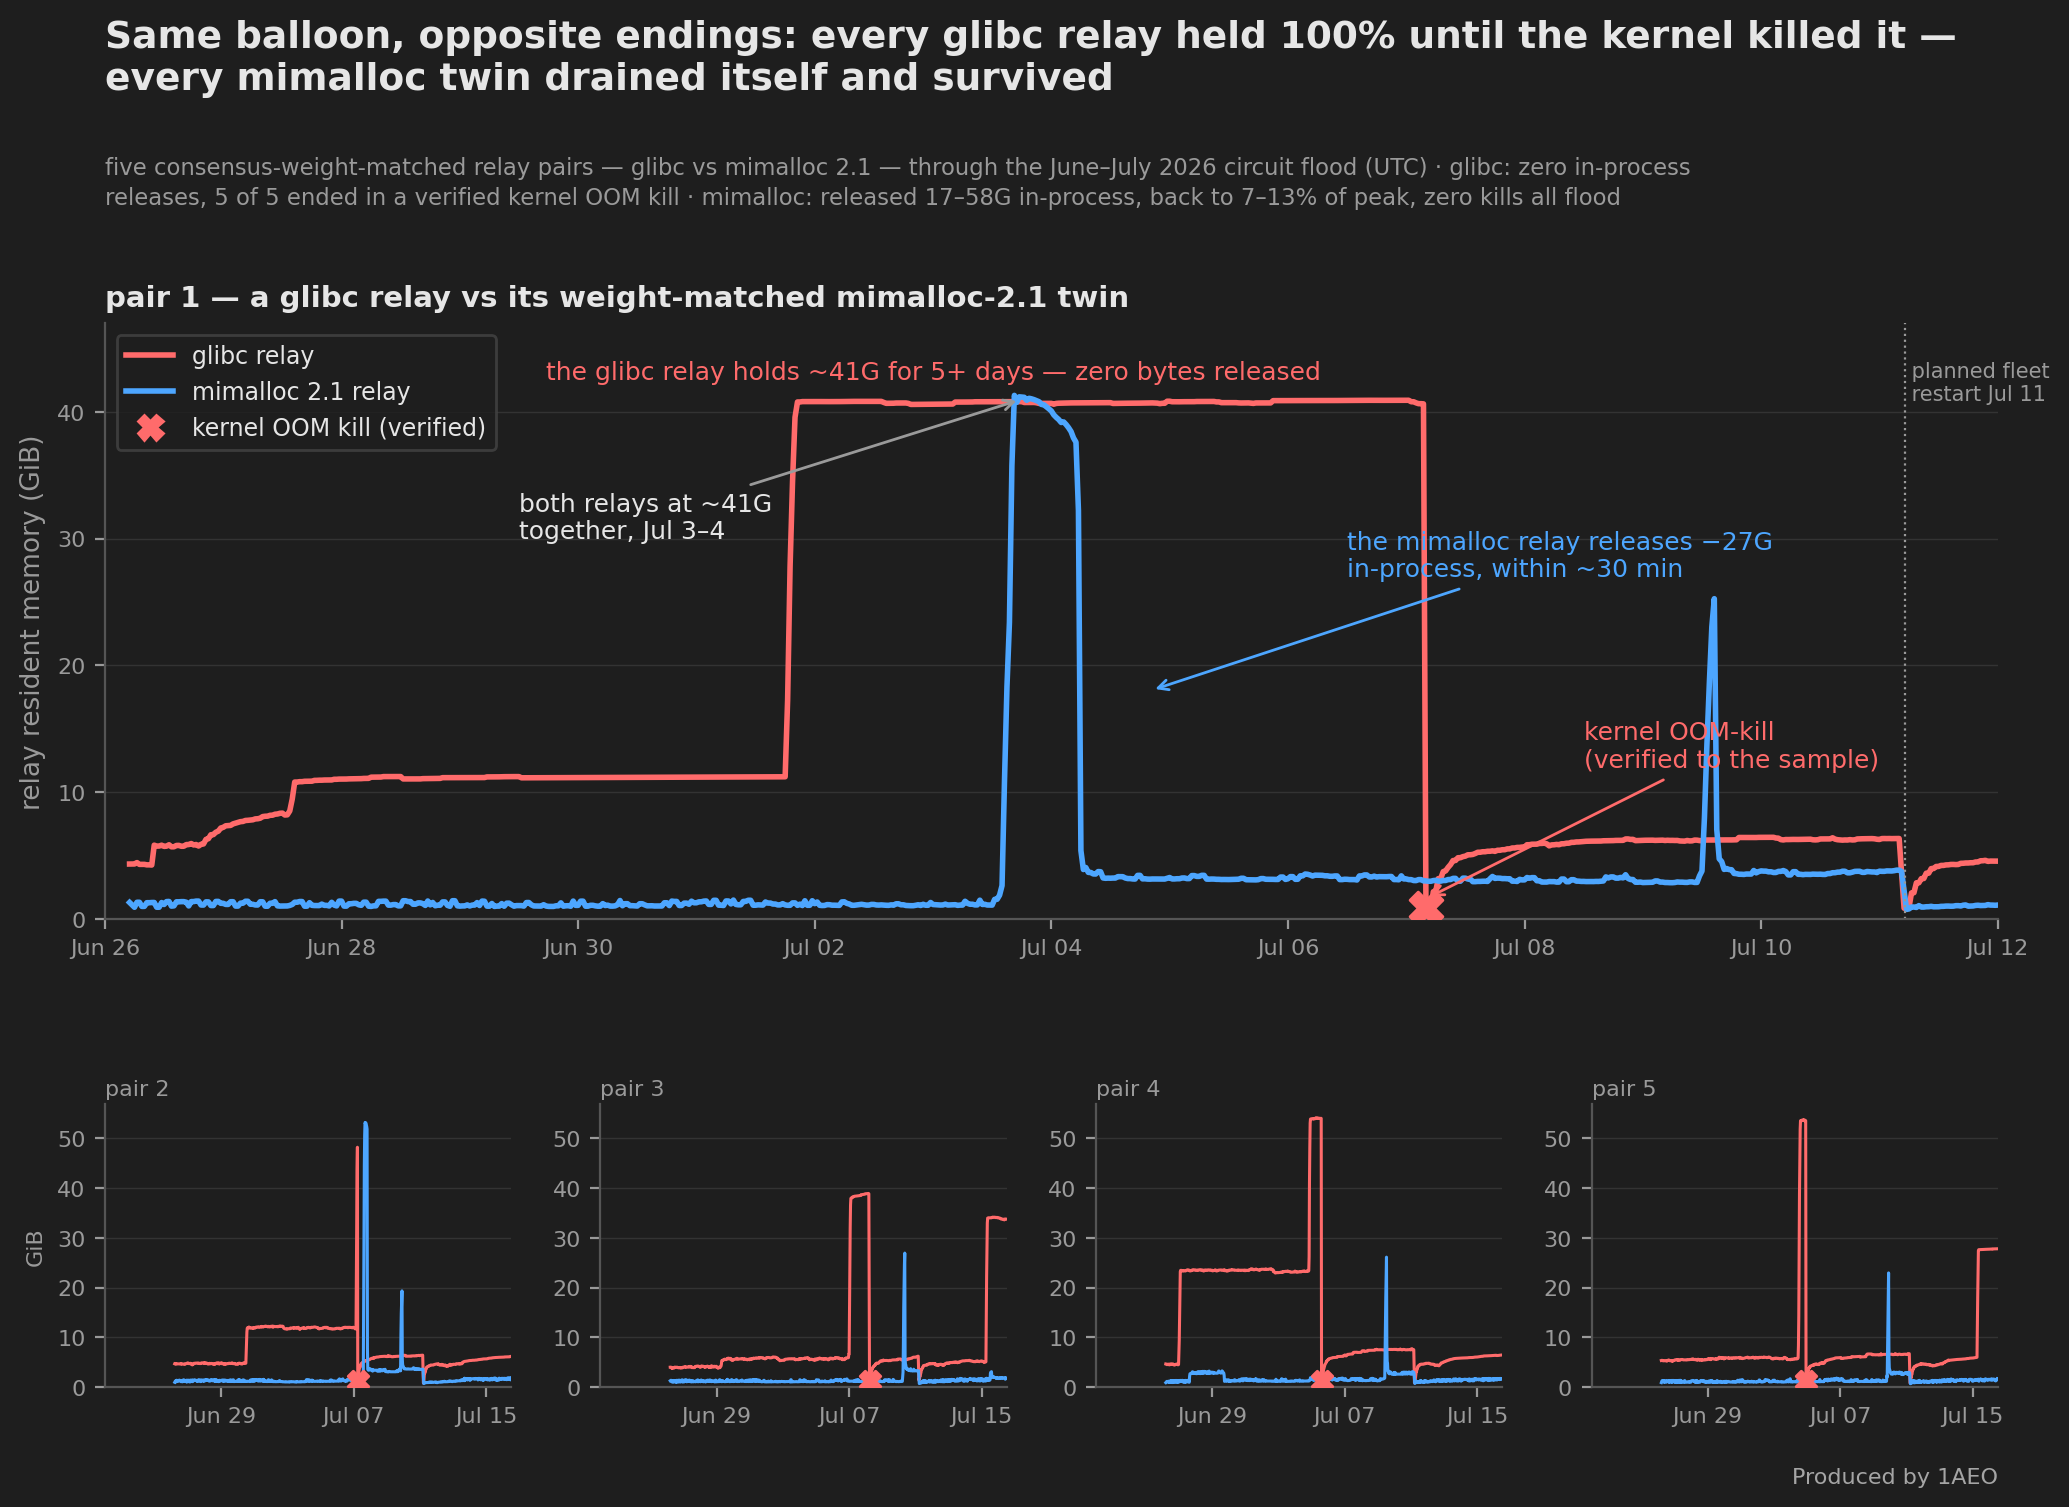
We paired five relays running glibc's allocator with five running mimalloc 2.1, matched ex-ante on consensus weight (within 10%), and followed each pair through the whole flood. Matching on weight matters because the flood's load tracks weight — and the exposure was indeed comparable: both sides of every pair ballooned to roughly the same peaks, about 24–54 GiB of resident memory per relay.
The Split Was 5-for-5 #
Then the endings diverged completely. Every glibc relay held 99–100% of its balloon — zero bytes released, for days — until the kernel OOM-killer terminated it (about 15 tor-relay kills on the host running them, verified in the kernel journal). Every mimalloc twin returned its balloon to the operating system in-process — 17–58 GiB per relay, one of them within a single 30-minute sample — and finished the flood with zero kills.
The allocator does not cap the peak. Mimalloc's single worst balloon, roughly 94 GiB, was the largest in our fleet. What the allocator decides is whether that memory ever comes back without intervention.
A Kill Required Both Ingredients #
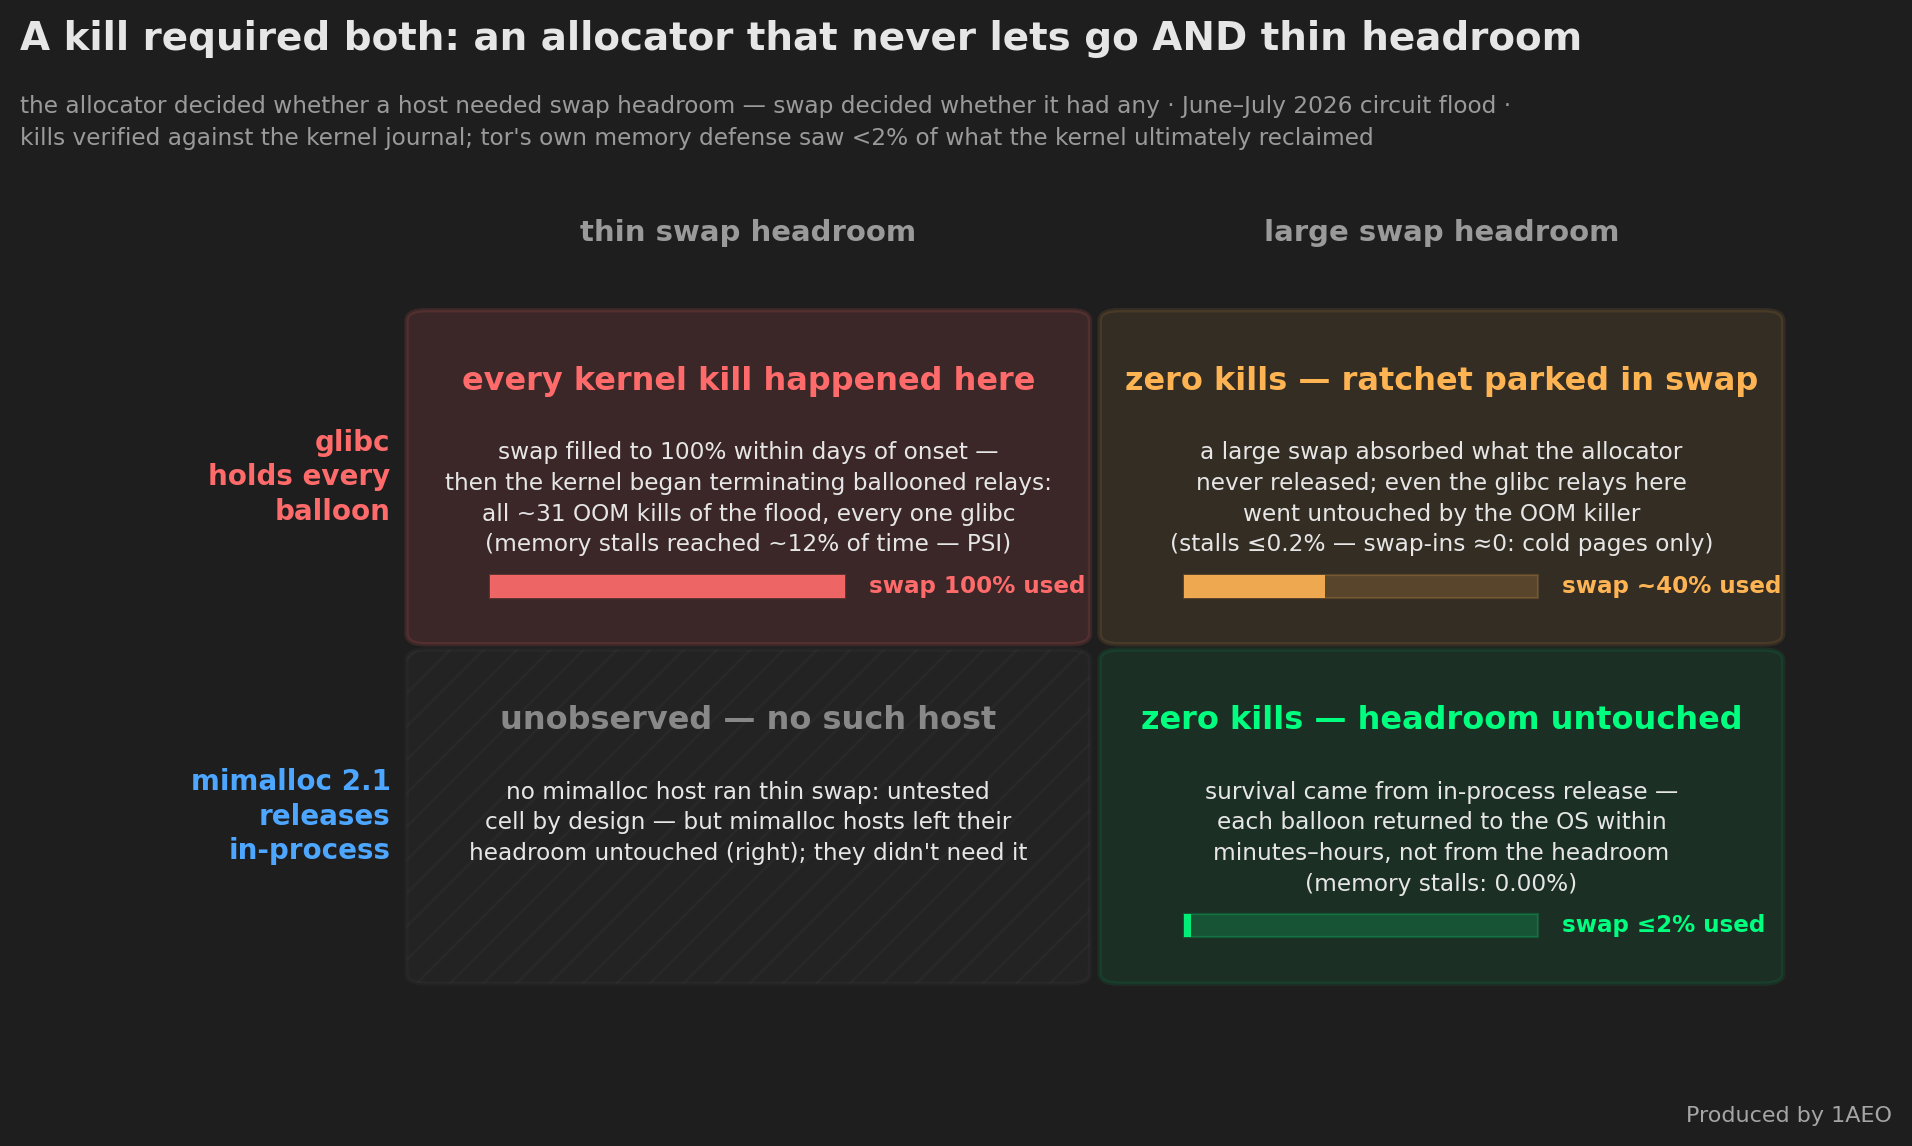
A kernel kill required both a hold-everything allocator and thin swap headroom. The allocator decides whether a host needs headroom; swap decides whether it has any. Our mimalloc hosts survived while using essentially none of their swap. A glibc cohort with large swap also survived — by parking the retained ratchet there, filling about 40% of swap capacity. The only kills happened where glibc retention met swap that filled to 100%.
Swap Parked the Flood — It Did Not Thrash #
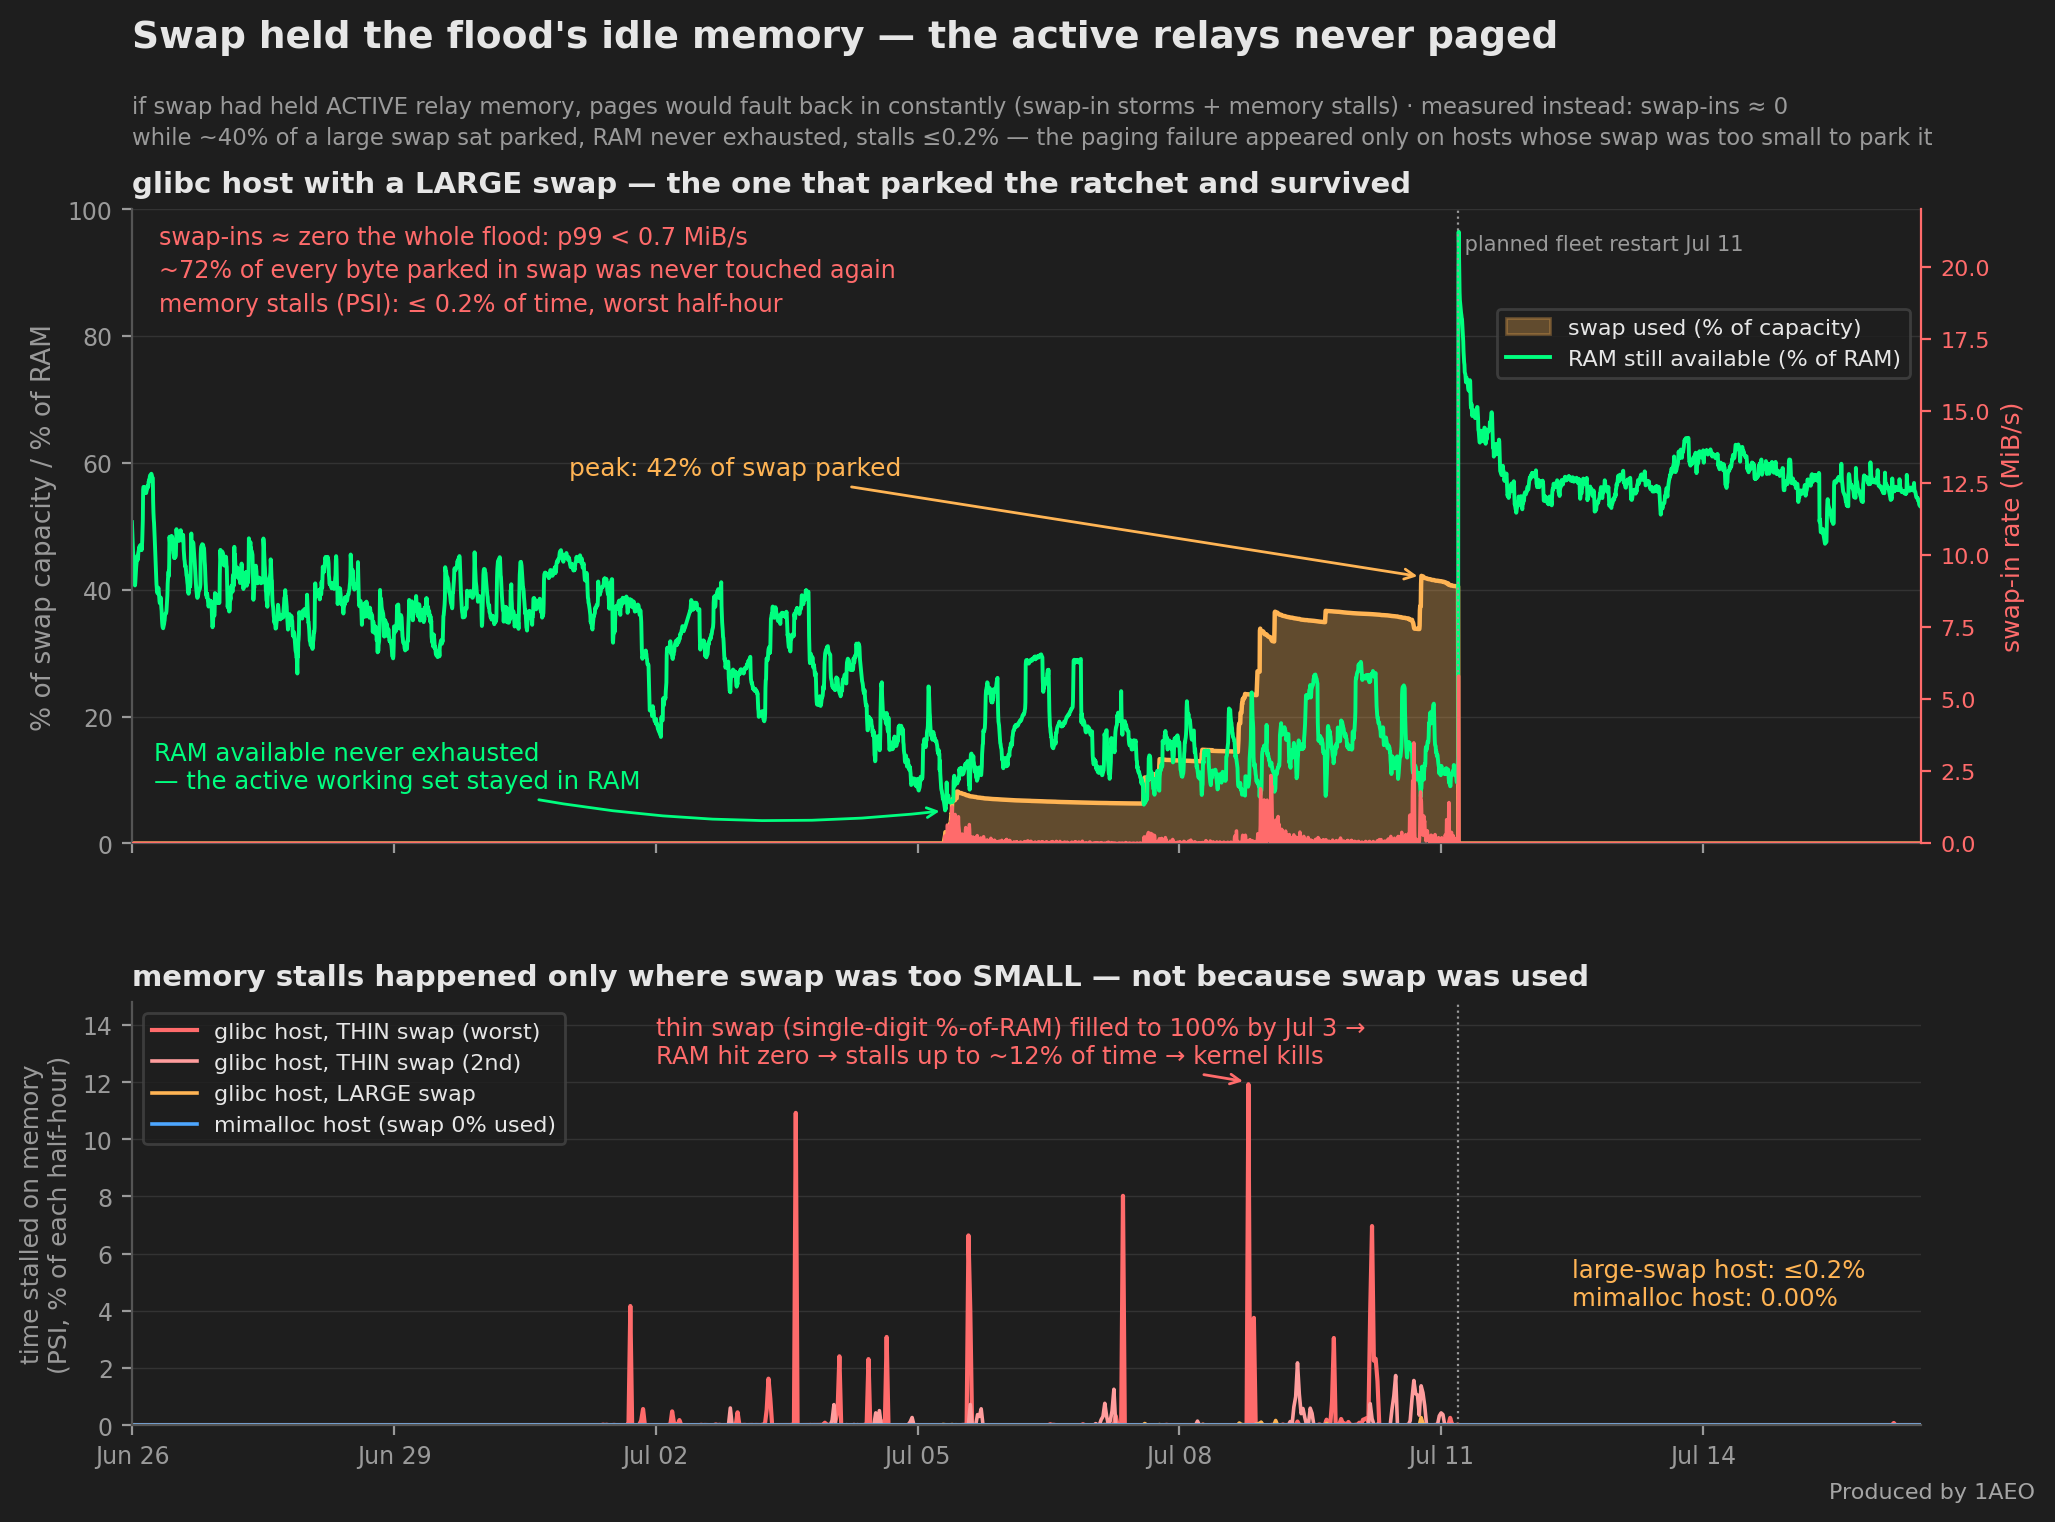
“Park it in swap” sounds like a recipe for thrashing. It was not — because the flood's balloon is overwhelmingly cold memory. On the parking host, pages swapped back in stayed near zero for the entire flood (99th percentile under 0.7 MiB/s), about 72% of parked bytes were never touched again, and time stalled on memory (PSI) stayed at or below 0.2% of the worst half-hour. The thrash failure mode is real — but it appeared only where swap was too small and both pools were exhausted: there, stalls reached up to ~12% of time.
The July Re-Test — And the Conversion We Shipped #
The flood then changed shape, and production re-ran the experiment for us. Between July 23 and July 27 a different mode — a directory-write / slow-read pattern that ballooned outbound cell queues instead of accumulating idle circuits — drove memory straight back to cliff levels. Free RAM on the hosts still running glibc fell to 2.70% and 2.58% of capacity and kept dropping back into that band across roughly three days. Elsewhere on the fleet a relay on one of the mimalloc hosts re-ratcheted to 83.60 GiB resident — the second-largest balloon we have recorded, and it gave the whole thing back within four hours. The ~94 GiB record still stands.
And nothing died — though the pressure was not invisible: 1AEO relays reported consensus overload for the first time in a year, an episode that had already turned before our July 28 restart (the count was falling in the July 27 descriptors, and tor's memory handler went quiet hours ahead of the restart). Zero kernel OOM kills for 13 straight days and counting, against roughly 31 relay kills during the June–July phase of the flood. The swap we added to those hosts after the June phase took its first real load, peaking at 6.4% of capacity, and tor's own memory handler released about 475 GB across those six days. That is the layering this post argues for, working end to end: the allocator and tor's handler give back what they can, swap parks the cold remainder, and the kernel never has to shoot anything.
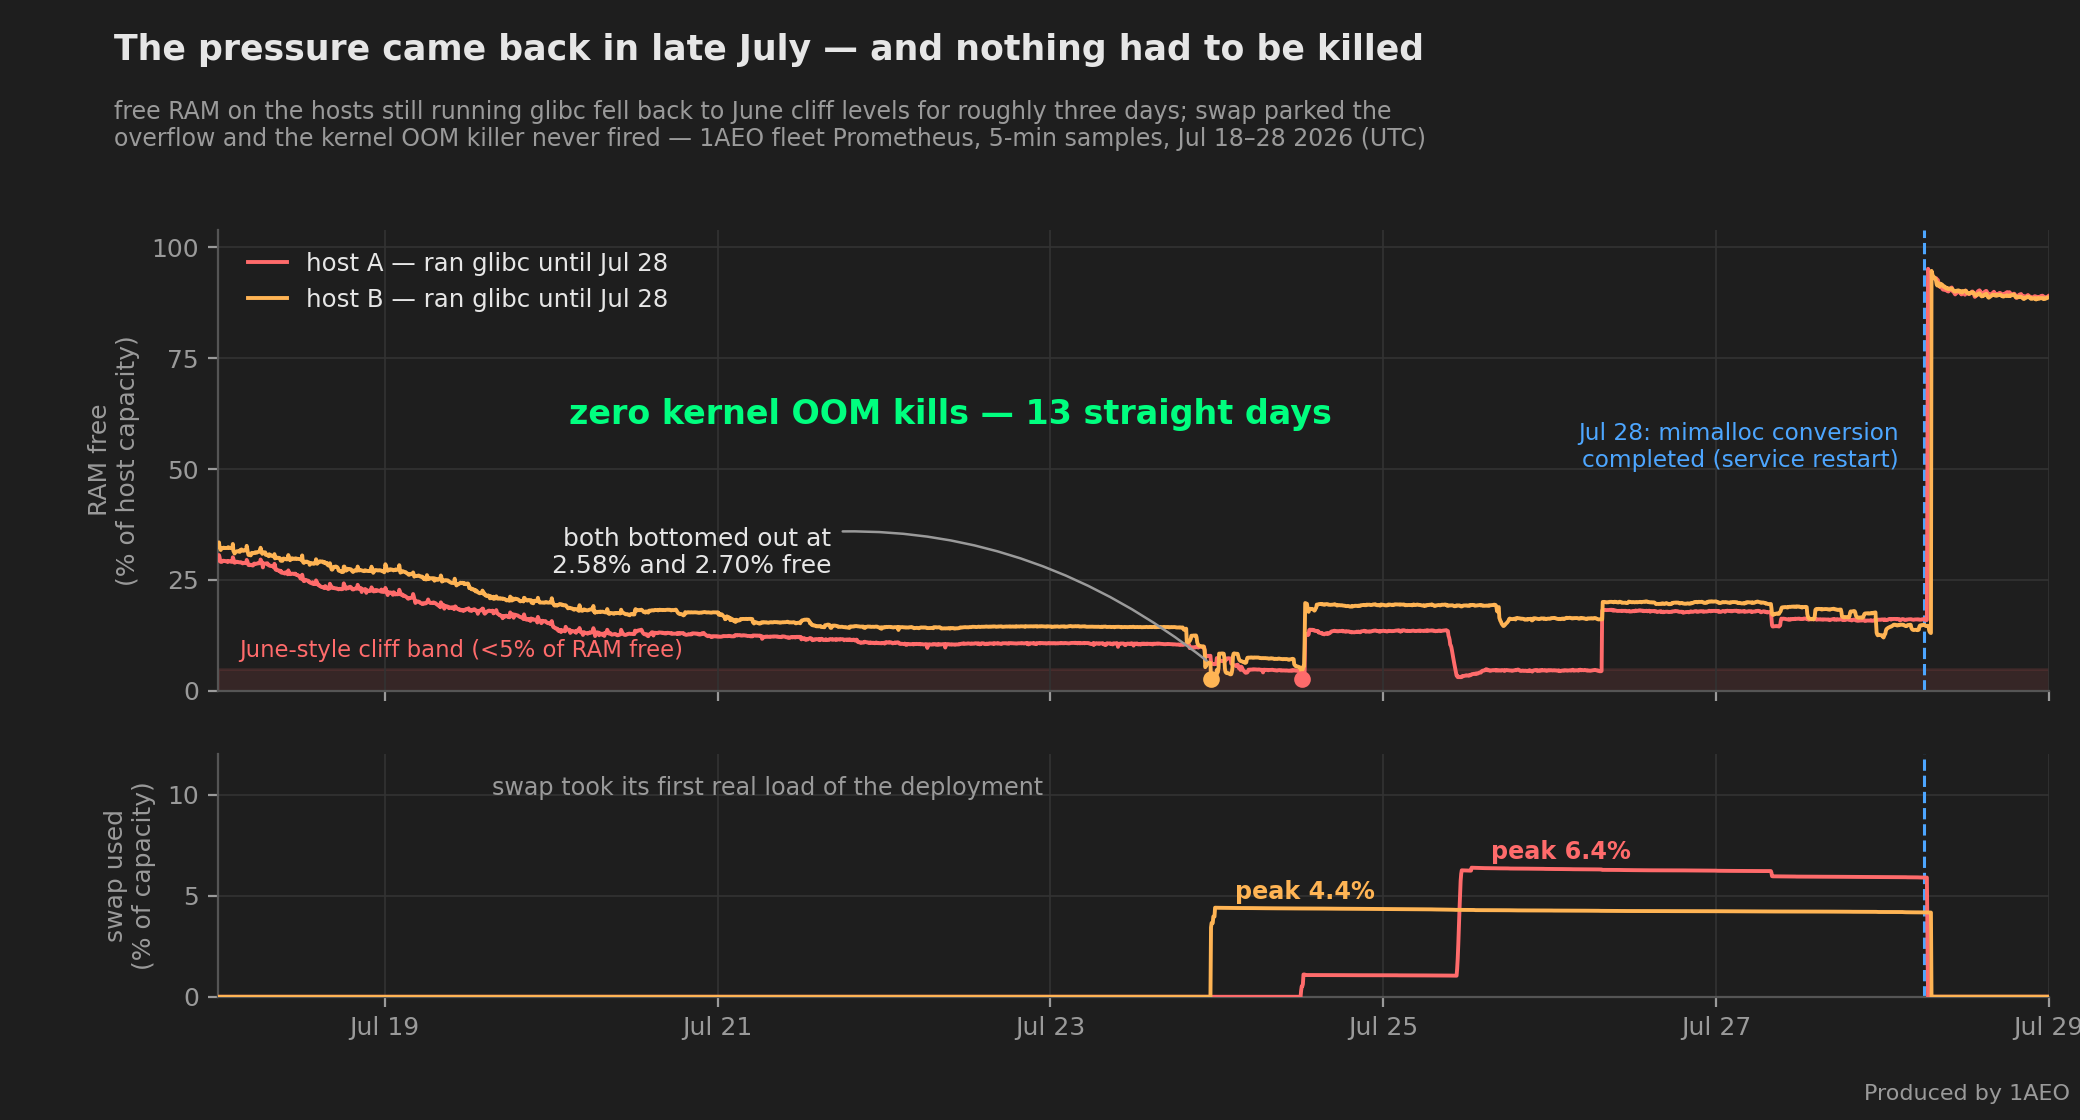
On July 28 the glibc relays that carried every one of this flood's kernel kills were converted to mimalloc 2.1, in a fleet-wide service restart of about 781 relays — hosts not rebooted. A small remainder of the fleet still runs glibc. This post's own top recommendation, executed where it mattered most.
What We'd Tell Another Operator #
- Run an allocator that returns memory to the OS. Mimalloc 2.1 released in-process for us. It is not a peak cap — plan for the balloon anyway.
- Size swap to park a multi-day ratchet. Swap holds the flood's cold memory. If your RAM cannot hold the active working set, you will thrash — that is where our thin-swap hosts landed.
- Monitor PSI memory pressure and swap-in rate, not just RSS. RSS tells you the balloon's size; PSI and swap-in tell you whether it is actually hurting. July re-validated this one.
- Keep a hard bound (a cgroup memory limit) as the last-resort layer.
How We Measured #
Per-process resident memory and allocator identity come from our fleet Prometheus; OOM-kill counts from kernel journals; swap usage, swap-in rates and PSI memory-stall percentages from host kernel counters. Caveats: five pairs is a small sample, but the split was 5-for-5 and the mechanism (release vs. retention) is visible in each trace; RAM and swap figures are percentages of each host's own capacity; the mimalloc-with-thin-swap cell was never observed here. The July re-test uses the same counters over July 18–28; the July 28 fleet-wide service restart is that conversion, not a relay failure — our Running relay count held flat through it. The flood is not over: as of July 29 its malformed-circuit, directory-write and onion-service introduction modes have gone quiet in our telemetry, while the original circuit-rejection mode still runs. As always, aggregate counters only: nothing here involves inspecting sources.
Related reading: What It Actually Costs — the CPU and memory bill this experiment sits inside — and Tor's own memory defense — why tor's built-in OOM handler could not see this memory at all.