One Relay Ballooned to 94 GiB — Tor's Built-In Memory Defense Never Fired
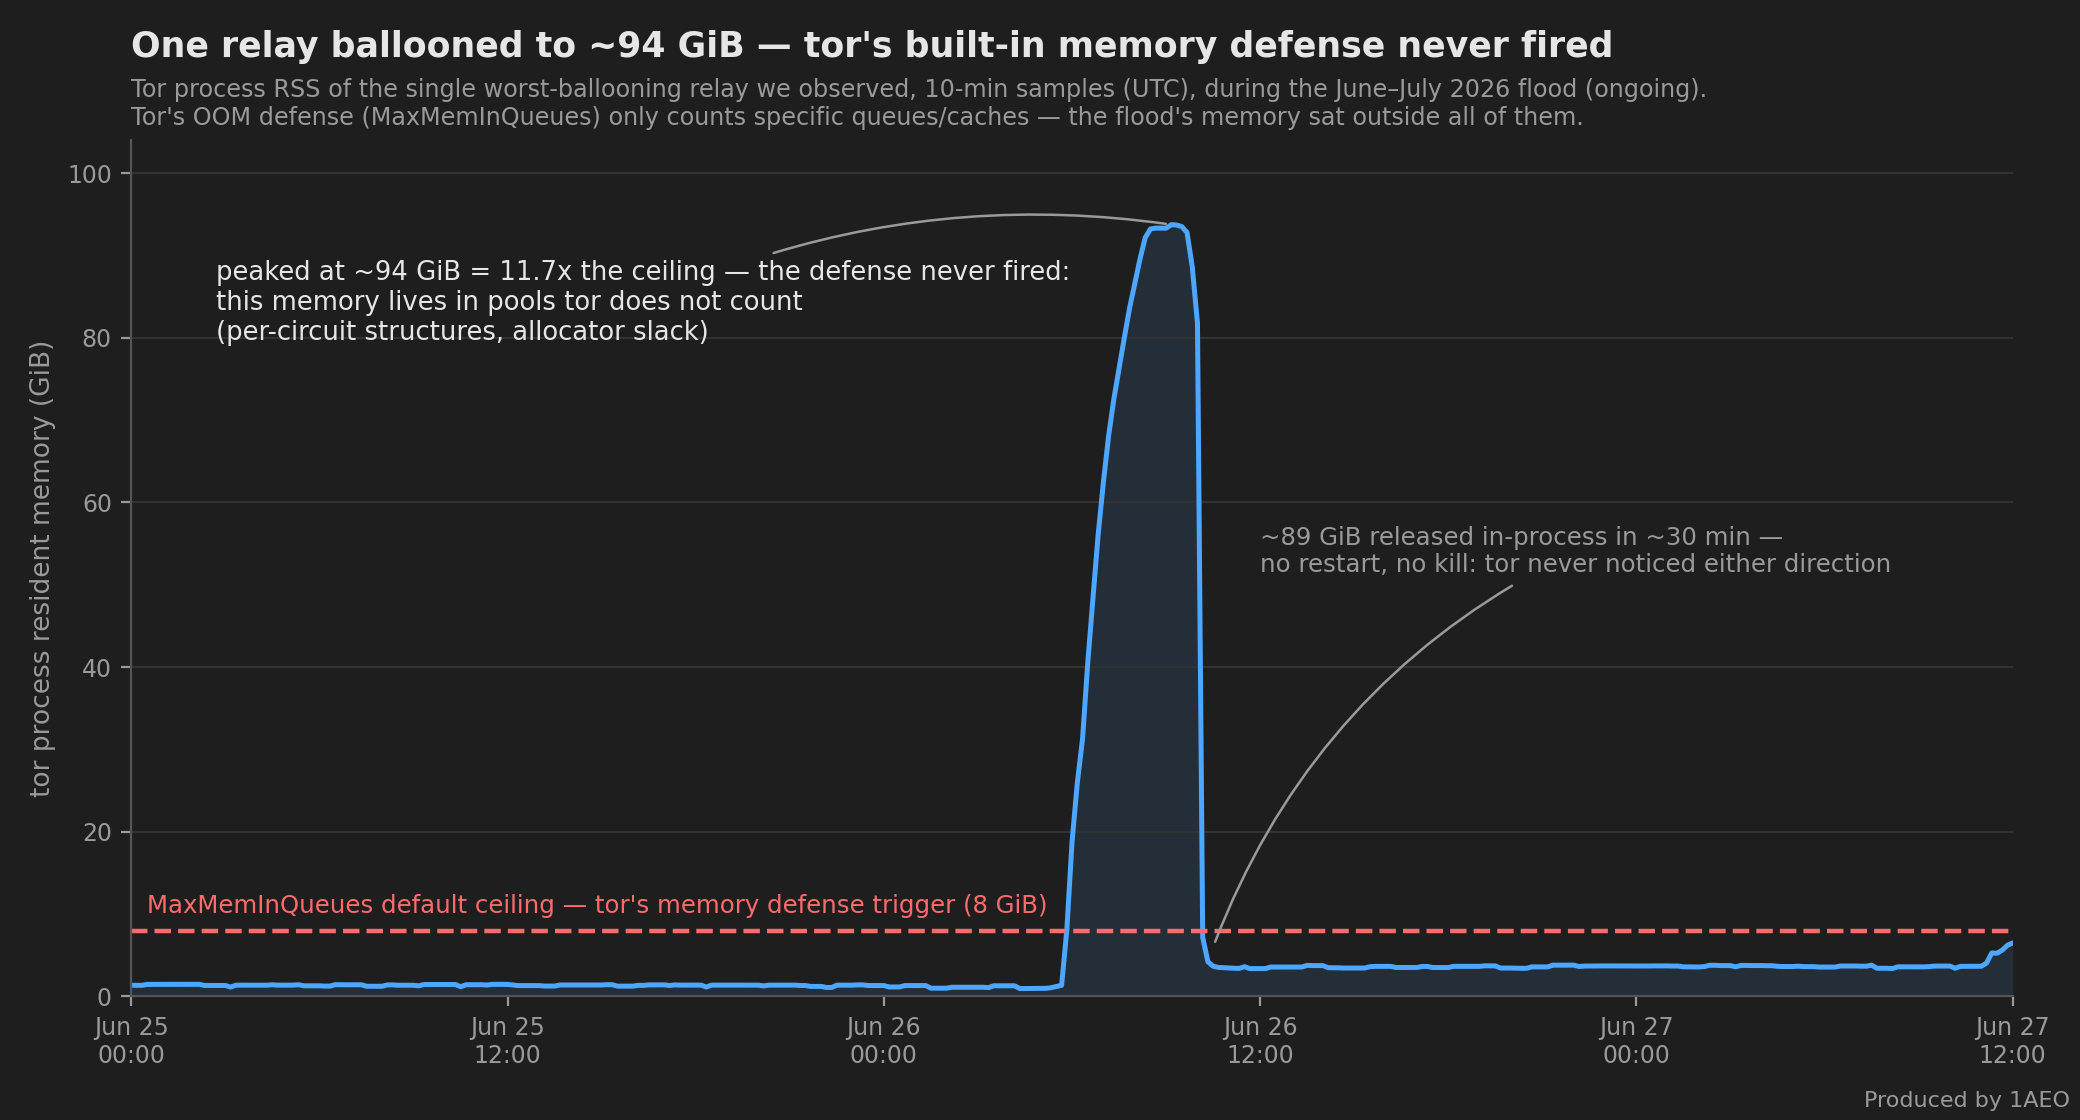
Tor ships a last-line memory defense. MaxMemInQueues sets a cap on the memory tor believes it is using; when tor's accounting crosses that cap, tor kills circuits to free RAM. The default cap is min(0.4 × RAM, 8 GiB) — on any big-RAM relay host, exactly 8 GiB. During the June flood we watched that defense sit silent while relay processes grew to more than ten times its ceiling. A month later the same defense fired hard against a different mode of the same campaign. The blindspot is vector-specific, and that is the whole story.
What the Defense Counts — and What It Doesn't #
The cap is enforced against a specific set of internal pools: cell queues, half-streams, connection buffers, compression state, the onion-service descriptor cache, GeoIP and DNS caches, and conflux. It does not account the per-circuit structures, relay crypto state, or allocator overhead. That second list is exactly where an idle-circuit flood's memory lives — millions of open-but-idle circuits carrying almost no cells.
1.3 GiB to 94 GiB, and Tor Never Noticed #
The worst-ballooning relay we observed went from ~1.3 GiB of resident memory to ~94 GiB — 11.7x the defense's 8 GiB ceiling — and the defense never fired. Then, in the space of about 30 minutes, ~89 GiB came back in-process: no restart, no kill. Tor never noticed the memory on the way up or on the way down, because by its own accounting almost none of it existed.
In That Phase, the Kernel Did the Defense's Job #
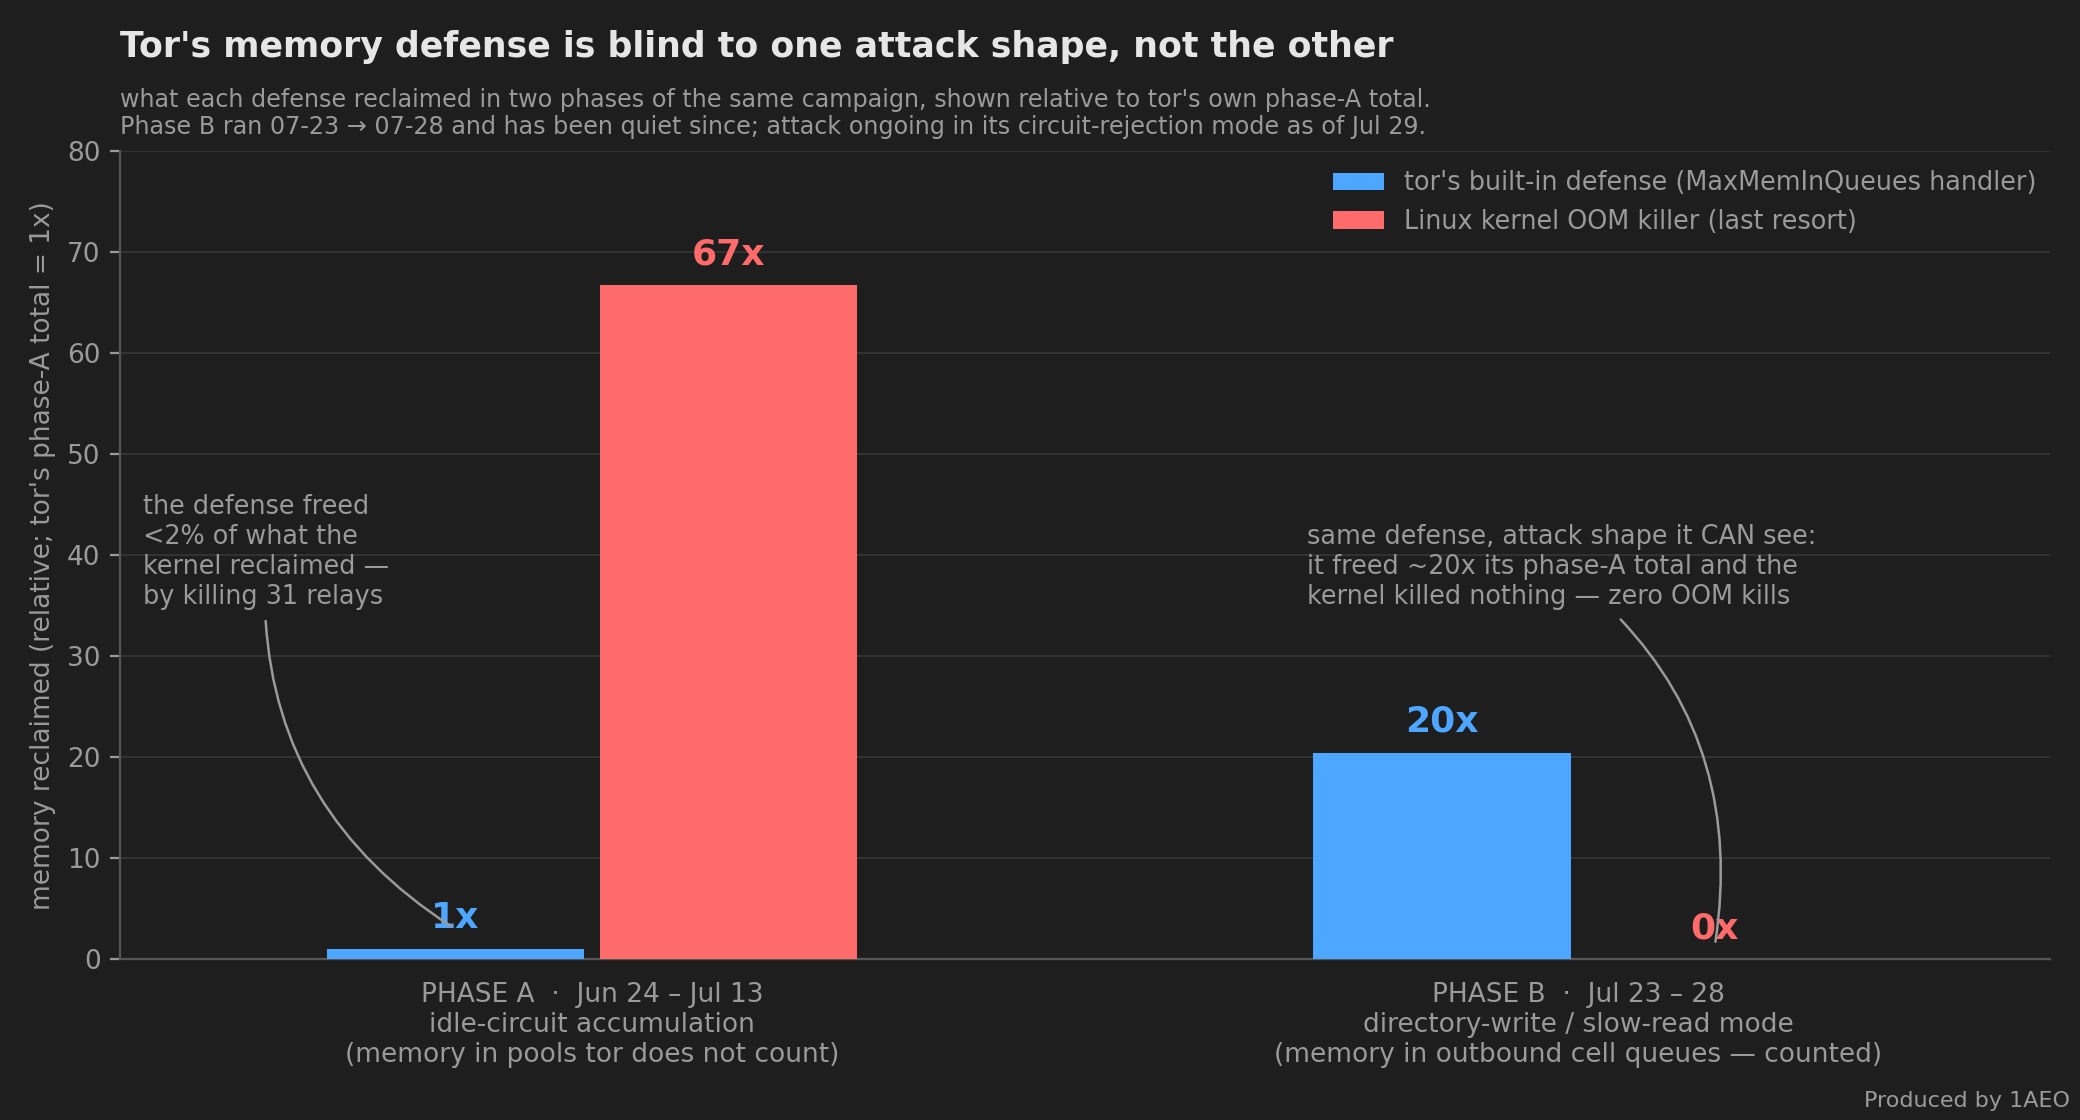
Over the idle-circuit accumulation phase — June 24 through July 13 — tor's defense freed less than 2% of the memory the Linux kernel OOM killer ultimately had to reclaim by killing relay processes outright; the kernel reclaimed roughly 67x more. We count ~31 tor-relay kernel OOM kills in that phase, each verified in the systemd journal. When the application-level defense is blind, the operating system's last resort becomes the actual defense — and its remedy is killing the whole relay. That ratio describes that phase — not the campaign as a whole.
The Blindspot Is Vector-Specific #
From July 23 the flood switched to a directory-write / slow-read mode. That mode does not park memory in idle circuits — it backs up outbound cell queues, which are an accounted pool. The defense saw it immediately and fired hard: roughly 221 GB freed fleet-wide on July 23, another 117 GB on July 27, ~475 GB in total, and then quiet since the early hours of July 28 — three hours before that morning's planned fleet-wide restart, so the stop is not a restart artifact. It worked. Kernel OOM kills across that entire stretch: zero — the last one on our fleet was July 11, more than two weeks before this update — against ~31 in the June phase.
What It Costs When It Works #
Every invocation of the handler also sets tor's overload-general flag. So while the defense was doing exactly its job, our fleet self-reported up to 92 relays "overloaded" across six days (94 in the public descriptor archive) — 135 distinct relays, 13% of the fleet, at least once. Not one failed: every relay stayed up, none dropped out of the consensus, and no 1AEO relay has reported overload since July 28 — though a planned fleet-wide restart that same morning also cleared tor's in-memory overload state, so read that last point as consistent with the episode ending rather than as proof of it. Read literally, the signal said the fleet was buckling. What it actually said was "the memory defense is running."
The ballooning itself has not stopped either. A single relay re-ratcheted to 83.60 GiB on July 27 — the second-highest per-relay figure we have ever recorded, behind the ~94 GiB above — and went balloon, handler dump, back to normal inside four hours.
The Same Blindspot Backwards: a 128 MB Footgun #
The accounting cuts the other way too, with no attack needed. A relay with DirCache enabled runs background consensus-diff compression, and each lzma job is accounted at ~93 MiB. Two concurrent jobs exceed a 128 MB MaxMemInQueues cap — so such a relay enters OOM circuit-killing every consensus cycle with zero attack traffic, and killing circuits cannot free compression state anyway. We watched this chronic false positive on a few tightly-capped test relays, firing daily since before the flood. If you cap a relay, set MaxMemInQueues to at least ~512 MB–1 GB, or set DirCache 0.
What We're Asking For #
The defense isn't broken. It sees one memory shape and not the other, and it cannot tell you which is happening. Two changes:
- Account per-circuit memory, or add an RSS-based trigger, so the defense sees both shapes — queue backlog and idle-circuit accumulation — instead of only the one that lands in counted pools.
- Split the overload signal. "The memory defense is working" and "this relay is failing" currently emit the same flag. Six days of our fleet reporting overload while every relay stayed healthy is what that conflation looks like from the outside.
Both belong to the list in our defenses post.
How We Measured #
Per-relay tor RSS from 1AEO's fleet Prometheus, 10-minute samples; memory freed by tor's handler from its own OOM byte counter, summed over 6-hour windows; kernel OOM kills from the systemd journal and the kernel's kill counter; overload reporting cross-checked against public relay descriptors. The accounting behavior (which pools MaxMemInQueues covers, the min(0.4 × RAM, 8 GiB) default, the ~93 MiB-per-lzma-job accounting) is verified against tor 0.4.9.9 source. Private telemetry is reported as per-relay GiB, event counts and ratios only; handler totals are decimal GB, per-relay memory binary GiB. One caveat: a planned fleet-wide tor restart on the morning of July 28 reset in-memory overload state, so overload counts after that date are not comparable with earlier ones — the handler going quiet at 03:00 UTC, three hours ahead of it, is not affected.
Related reading: What It Actually Costs — Part 3's memory section, where the ballooning first appeared — and Defending Against Circuit-Building DoS — Part 5, the full list of metric and protocol asks this post's fix belongs to.