The Flood Below Tor: A Billion Handshakes the Relays Never Saw
Part 4 of a five-part series on the June–July 2026 circuit-building DoS. 1. The Tor Network Is Under a Circuit-Building DoS Wave — the network-wide view from Tor's public data. 2. Anatomy of the Attack — the three waves and how each one works. 3. What It Actually Costs — the CPU and memory bill, and how 1AEO ranked. 4. The Flood Below Tor (you are here) — the connection flood Tor's own counters cannot see. 5. Defending Against Circuit-Building DoS — better metrics and the protocol fixes we're asking for.
Everything in the earlier posts happened inside Tor — circuits, handshakes, DoS counters, memory. This post is about what was happening underneath it. Over the same weeks, the Linux kernel on 1AEO's relay hosts quietly turned away roughly 1.3 billion fully-completed TCP connections at the door — connections that finished their handshake and were then dropped before Tor ever learned they existed. No Tor log line, no Tor metric, no DoS-defense counter records them. If you only watch Tor, this entire layer of the attack is invisible — and as we publish, on our hardest-hit hosts, it is still going on.
What Is an Accept Queue? #
When a connection arrives at any TCP service, the kernel completes the three-way handshake and then parks the finished connection in a short line — the accept queue — where it waits for the application to pick it up (a system call literally named accept()). The queue is small, and it only drains as fast as the application collects from it. If the application is starved for CPU, or the arrival rate is simply too high, the queue fills — and the kernel silently discards fully-established connections. The only trace is a pair of kernel counters, ListenOverflows and ListenDrops, that most monitoring never looks at. The application — here, a Tor relay — never sees the connection at all. From the connecting side, the connection appears to succeed and then die; the natural response is to retry, which adds more load.
A Billion Handshakes Dropped at the Door #
Before the flood, these counters were near zero on 1AEO's hosts — single digits per second at most, with occasional brief bursts. From late June they exploded: about 1.3 billion accept-queue drops between the flood's onset and July 11 — roughly 900 per second, sustained for two weeks, with fleet-wide half-hour peaks above 2,500 per second. (Our fleet-wide maintenance restart on July 11 produced its own brief burst of drops as everything reconnected — that day is marked on the chart and excluded from every number here.)
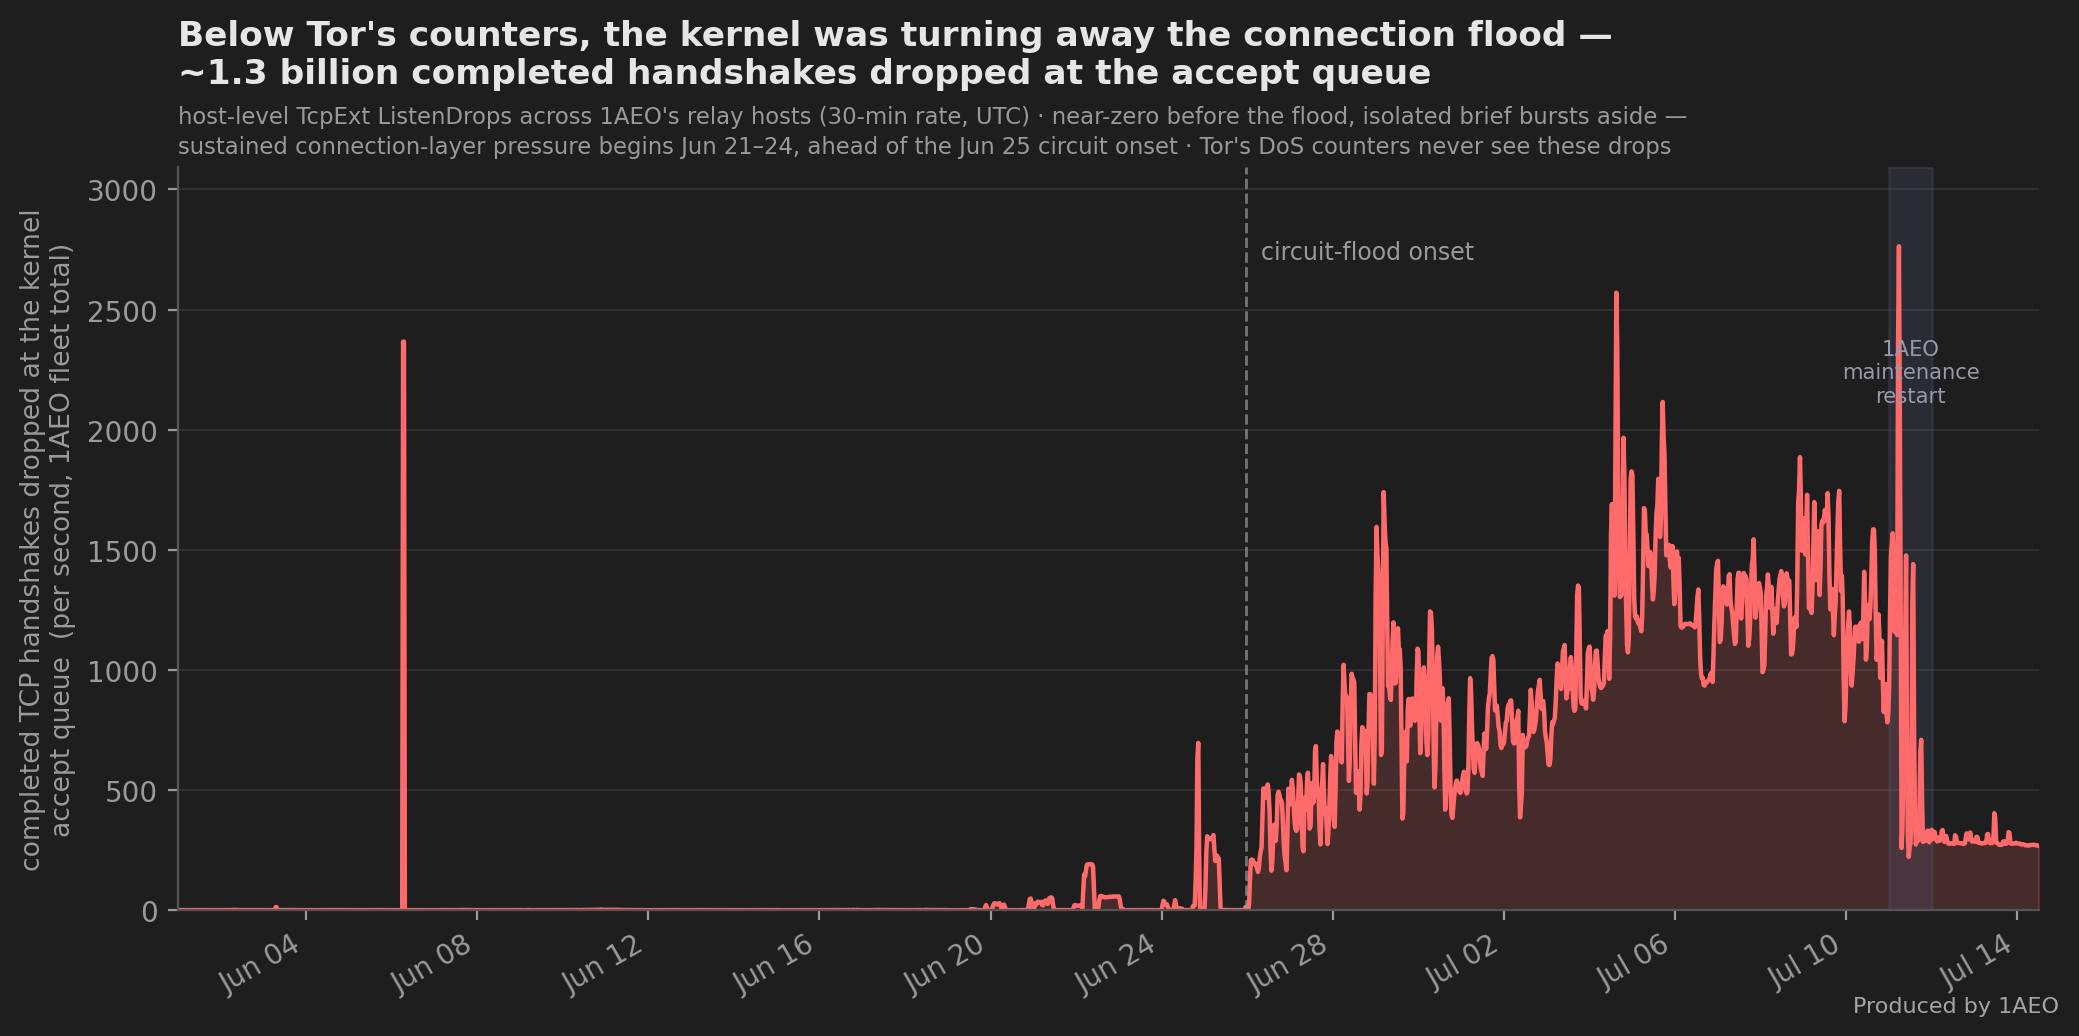
Two details in that curve matter beyond its size. First, the connection flood arrived before the circuit flood. Sustained drops begin on our hosts on June 24 — one to two days ahead of the June 25 23:00 UTC circuit onset that anchors the anatomy post — and the first clear pressure appears even earlier, on June 21 (the anatomy post had already noted a 12-hour circuit "probe" on June 22). At June 24, 20:00 UTC the fleet's inbound connection rate spiked to ~6x its normal level. We checked the obvious alternative explanation: these were not our own restarts — our deployment logs show that, aside from a single routine deploy, no relay processes restarted on the hosts we monitor that week. Second, it hasn't stopped. The circuit flood has eased from its peak, but 1AEO's hardest-hit hosts are still shedding a couple hundred connections per second at the kernel as we publish.
What Tor Accepted Barely Moved — Because the Kernel Shed the Excess #
The cost post reported that our established-connection counts and new-connection rate "barely moved" through the flood — that is how we knew the circuits were arriving over existing connections. The kernel counters complete that picture: the connection rate Tor saw stayed nearly flat (about 1.05x its pre-flood level) because the kernel was discarding the growth before Tor could see it: new connections were completing their TCP handshake and piling into each relay's accept queue faster than its overloaded main thread could pull them off, so the kernel dropped the overflow. Adding accepted and dropped together, the load actually offered to our hosts roughly doubled. On the hardest-hit hosts, 35–46% of all inbound completed handshakes were dropped at the accept queue over the whole flood — in the worst half-hours, over 70%.
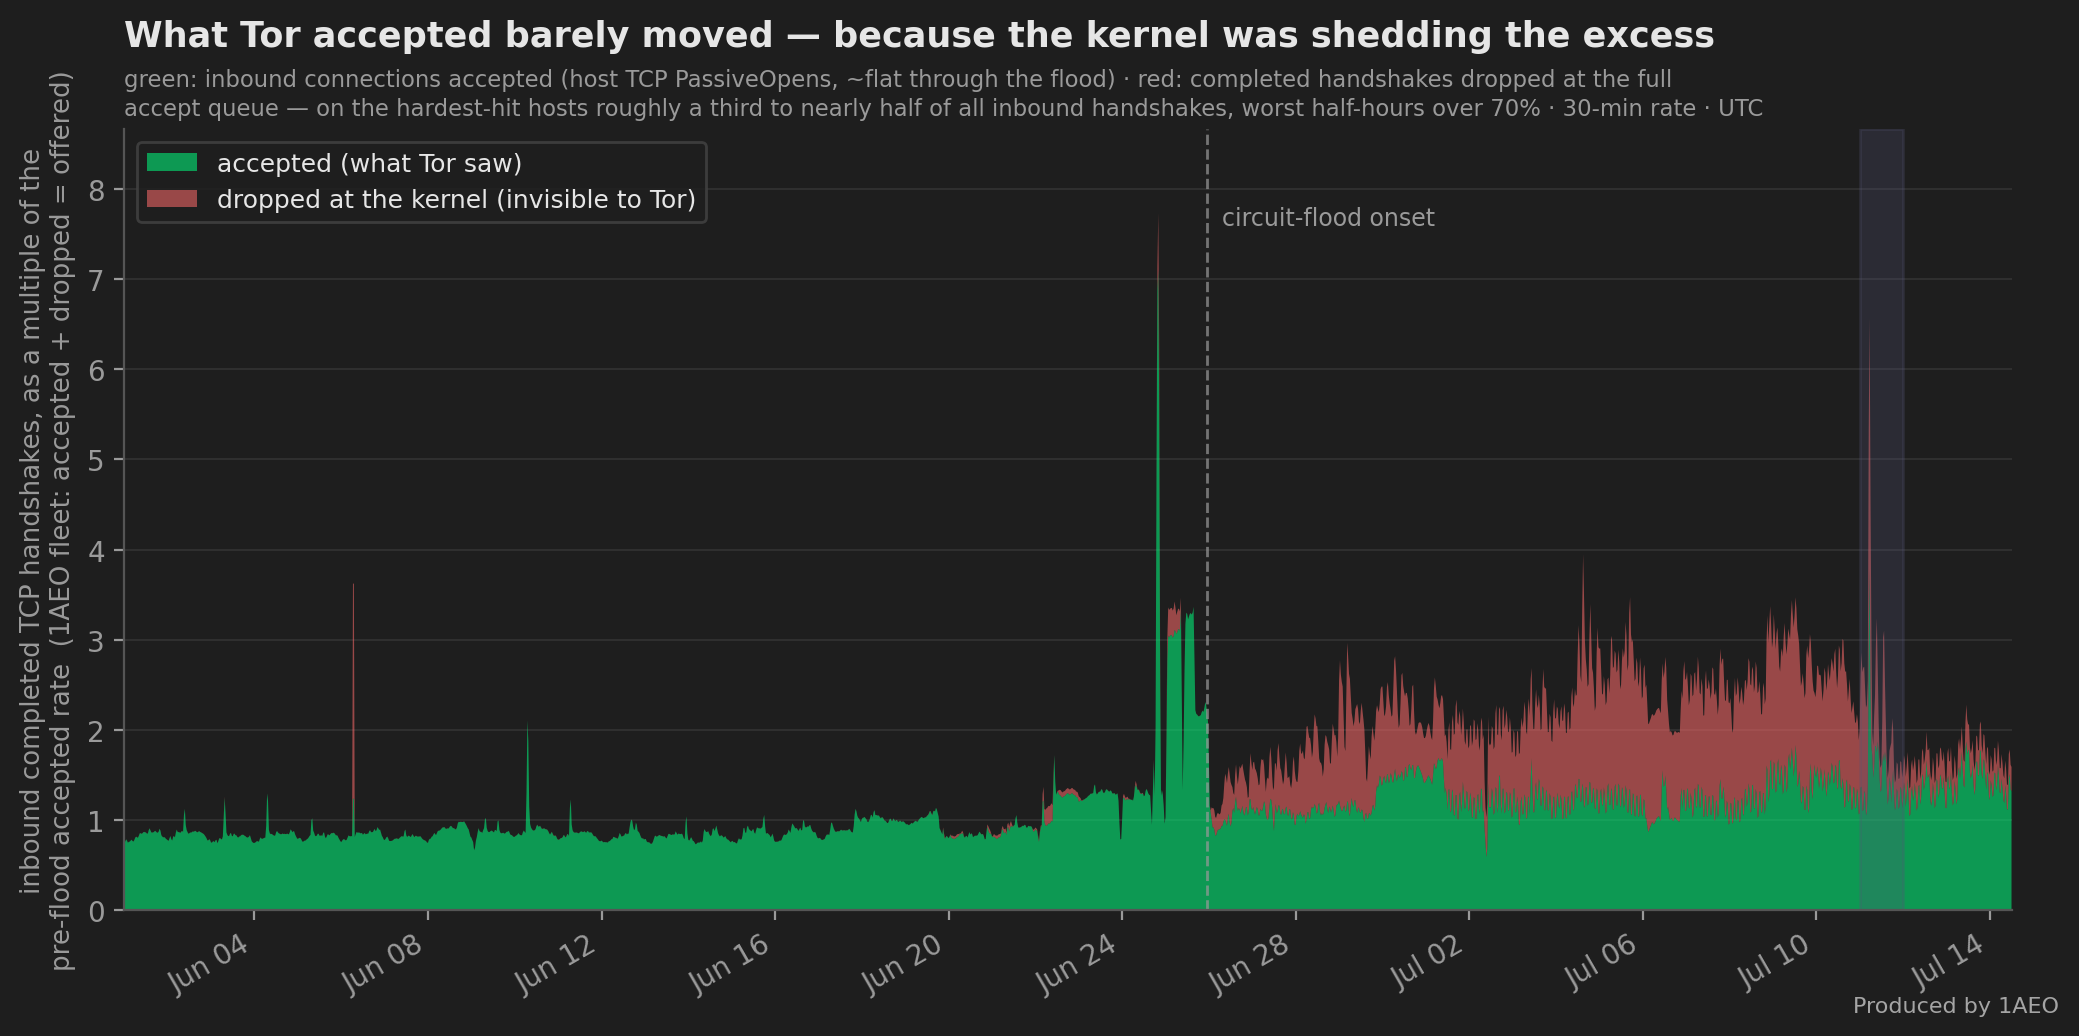
One consequence reaches beyond our own fleet: a dropped connection looks, to the source, like a connection that mysteriously died — so sources retry. SYN retransmissions — the automatic retries a connecting machine sends when its handshake goes unanswered — ran toward our hardest-hit hosts at six to seven and a half times their pre-flood rate through the flood. Whatever fraction of those sources are legitimate, they experienced our saturated hosts as flaky — the same underlying mechanism that made loaded relays fail the directory authorities' reachability probes in the network post: a machine too busy to answer the door.
What It Is — and Isn't #
- Not a SYN flood. A SYN flood spams half-open handshakes and never completes them; the kernel's countermeasure (SYN cookies) fired exactly zero times on every host we monitor, throughout. These connections completed their handshake and were dropped afterwards, at the accept queue — on our hosts
ListenOverflowsandListenDropsagree to better than 98.7%, which is precisely the full-accept-queue signature. - Not connection-tracking exhaustion. Most of our relay hosts run no connection tracking at all — with no stateful firewall or NAT to pull in the kernel's conntrack subsystem, a relay's connections are never entered into a tracking table, so there is no table to fill. Where a host does run conntrack — for an unrelated networking reason — it sat far below a raised, multi-million-entry ceiling, nowhere near exhaustion.
- Not something Tor mis-counting. The drops live in kernel counters, upstream of Tor; Tor's own accounting is consistent — it faithfully reports the connections it was given.
- It tracks CPU saturation — and here is exactly why, measured directly. Accepting a new connection is the job of each relay's single main thread — the same event loop that also has to keep pace with the flood of circuit cells — while the expensive ntor handshakes run on separate CPU worker threads (confirmed in Tor's source:
accept()is on the main loop; the handshake is dispatched to a worker pool). Under the flood those workers pinned every core, leaving far more busy threads than cores, so a loaded relay's main thread had to wait its turn to run — and the effect is per relay, not per host. We can still watch it happen: on a host that is still shedding connections, a single high-traffic relay's accept queue sits pinned completely full at its backlog limit while that relay's process spends roughly a sixth of every second just waiting for a CPU — and the many lighter relays sharing the same host keep their queues empty. A main thread that starved can't callaccept()fast enough to drain the queue as connections arrive, so the kernel drops the overflow. The pattern holds fleet-wide: every host that kept CPU headroom shed effectively zero connections through the same flood, and a given host began dropping only once its CPUs saturated — not before. So CPU saturation is what tips a host from draining its accept queue to overflowing it — but what then overflows is set by how hard the flood is pushing, not by CPU alone. When the connection flood eased after our July 11 maintenance restart, a host that stayed just as CPU-pinned went from dropping over half its offered connections to essentially none — and when the flood surged back days later, the drops returned at the same CPU load. The accept queue overflows when arrivals outrun a saturated main loop: ease the arrivals and the same host keeps up.
Why Tor's Defenses Can't See This #
Here is the uncomfortable part. Tor does have connection-level DoS defenses, and on our fleet they did fire — the per-source concurrent-connection cap alone rejected some 27.6 million connections over the flood — the cumulative total behind the rejection rates charted in the anatomy post. It didn't matter: the kernel dropped roughly 40 times more connections than every Tor connection defense combined rejected. Those defenses run inside Tor, so they can only ever act on connections that survive the accept queue — and they act per source address, so a flood spread across enough sources stays under every per-source threshold while its aggregate saturates the host. A distributed connection flood is invisible to Tor twice over: most of it is dropped before Tor exists as far as the connection is concerned, and the rest doesn't concentrate enough per source to trip a limit. Today, the only real absorber is CPU capacity — which is an arms race an operator can only lose. That gap is a big part of why our asks to the Tor Project focus on limits that compose into an aggregate ceiling.
Check Your Own Relays #
Every operator can read these counters — they are standard Linux kernel statistics, and they are cumulative since boot, so sample them as deltas to see the burst windows:
# is the accept queue dropping completed connections right now?
watch -n5 "nstat -z 2>/dev/null | grep -E 'ListenOverflows|ListenDrops'"

# log a UTC-timestamped series (every 30s) — useful for cross-operator comparison
while :; do echo "$(date -u +%FT%TZ) $(nstat -z 2>/dev/null | awk '/ListenDrops/{print $2}')"; sleep 30; done

# differential: a SYN flood would show syncookies; this attack shows none
nstat -az | grep -Ei 'Listen|Syncookie'
If your relays show elevated ListenDrops with zero syncookies — concentrated on your busiest machines — you are seeing the same layer of this attack. Public operator reports of abnormal firewall-state growth during the same weeks are consistent with this connection-layer flood. We would gladly compare UTC-timestamped burst windows across operators and networks — synchronized bursts across unrelated infrastructures are the cleanest way to separate a coordinated external flood from any one operator's local load. Get in touch.
How We Measured #
Host-level kernel TCP counters (node_exporter: ListenDrops, ListenOverflows, PassiveOpens, syncookies, established counts) alongside Tor's MetricsPort, on hosts that run only Tor relays — all aggregate counters, as always: no packet captures, and nothing recorded about sources. Numbers here exclude our July 11 maintenance window, and we verified the onset against our own deployment logs so we would not mistake our restarts for an attack. One caveat: these kernel counters are host-wide, not per-port. But our relay hosts run nothing but Tor as a public-facing service — the only thing accepting inbound connections at any volume is the relays themselves — so effectively every inbound connection the host receives is a Tor connection, and the host-wide counters are Tor's.